The equity markets in India (and globally) have had an extraordinary rally in FY21 with Nifty 50 returns of 64%. Mid and Smallcap stocks have done even better with Nifty Midcap 100 return of 79% and Nifty Smallcap 100 return of 98%.
Most fund managers have benefitted from this rally but Portfolio Management Services (PMS) have done particularly well due to their higher small and midcap allocation. This has revived the debate on what’s the best way for investors to invest in the equity markets. While there is a clear shift towards passive strategies (index funds/ETFs) from active strategies, among active strategies too there seems to be a rising preference towards PMS over Mutual Funds (MFs)1.
This recent shift of investor flows towards PMS over active MFs is partly driven by the recent better performance and by higher distributions commissions. Some investors now argue that MFs can no longer deliver benchmark beating returns and therefore PMS is a better option. We believe that this discussion needs to be more nuanced. Both MFs and PMS have attributes which make them better or worse in different contexts.
Drawbacks of PMS over MFs
Higher Fees – Most PMS have a higher Total Expense Ratio (TER) compared to MFs. Direct MFs TER is in the range of 1-1.5% vs PMS TER of 1.5-2.5%. Higher fees mean that PMS need to generate higher gross returns to deliver the same net returns as MFs.
Tax Inefficiency – This is not a widely discussed point but PMS are tax inefficient compared to MFs. MF investors only have to pay the LTCG tax of 10% if they hold their investment for more than a year. Additionally, this tax only has to be paid when the investor redeems his investment. Any churn in the portfolio by the fund manager does not result in a tax liability.
Meanwhile, PMS investors are taxed just as direct stock owners. This results in a higher net tax rate as dividends/interest income are taxed at investor’s marginal tax rate, STCG at 15% and LTCG at 10%. The below illustration shows how for the same returns, PMS investors pay 30% higher tax resulting in a lower post-tax return by ~0.5%2. The tax rate differential gets further magnified if we also include cess and surcharge.
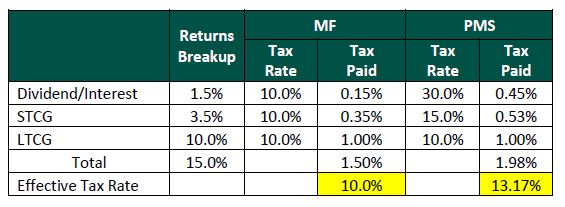
Unlike MF investors, PMS investors have to pay these taxes on an ongoing basis and not just on redemption. PMS investors’ tax liability has to be paid out when realized by the fund manager while for MF investors it accrues and continues to enjoy the benefits of compounding. This can further negatively impact PMS investor returns by ~0.4% over the long term.
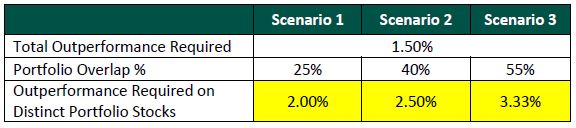
The higher fees and the tax inefficiency mean that PMS need to generate ~1.5% higher returns than MFs to deliver the same post-fees and post-tax returns. While this may appear a small number, it is not an easy task to outperform by 1.5% compounded annually over the long term. The task becomes particularly difficult if the PMS portfolios have a large overlap with the MF portfolios due to a similar investment approach. This is often the case in large-cap oriented strategies where a few stocks are typically owned by most fund managers (MF or PMS). The higher the degree of portfolio overlap, less likely that the PMS can outperform the MF. This is because while the common stocks will deliver the same returns, the entire 1.5% gap needs to be filled by the distinct stocks. The distinct stocks will require a higher outperformance to compensate for the same returns on the common stocks. The below illustration explains this.
While there will be exceptions, the negative fee and tax drag means that most large-cap PMS strategies will struggle to outperform similar large-cap MFs over the long term. If we start comparing large-cap PMS with the large-cap index funds, the drag (~2.5%) becomes even higher and outperformance even more difficult to achieve. With active large-cap MFs struggling to beat the index despite only a ~1% drag due to higher fees, it is difficult to envisage how a large-cap PMS can outperform the index with a ~2.5% drag and a large portfolio overlap.
Transparency – Unlike MFs, PMS is still very lightly regulated by SEBI. PMS performance reporting has particularly been an area lacking transparency. As per PMS Bazaar data of June 2020, there were as many as 6 different ways in which PMS were calculating returns (TWRR, Pre-Fees TWRR, Model Portfolio, Pre-Fees Model Portfolio, XIRR Aggregated, First Client Reporting). We believe the actual variance is much higher because PMS funds were using different methodologies to compute even the basic Time Weighted Rate of Return (TWRR) which was mandated by SEBI. This makes any comparison of performance between PMS or with MFs largely useless. MFs are far more transparent on this front with only 1 methodology being used. This makes comparisons like-to-like. Investors might invest in a PMS looking at the high reported returns using questionable methodology when the “true” performance is much lower.
SEBI has taken steps to standardise performance reporting with all PMS now required to report only TWRR returns (similar to how MF returns are calculated). A leading PMS fund’s 10-year returns CAGR had to be reduced by 300 bps when it was forced to shift from Model Portfolio return calculation to TWRR!! This shows how much some of the creative performance calculation methodologies can overstate the actual returns delivered to investors. Reporting standardisation alone will go a long way in increasing PMS transparency.
Where PMS score over MFs
Flexibility – This is one of the biggest advantage PMS have over MFs. Stringent SEBI regulations limit the flexibility of MF managers which impacts their ability to deliver alpha. Lesser the flexibility, lesser the value of active fund management.
For eg. SEBI restricts single stock allocation to 10% of the fund. This despite 2 stocks (Reliance and HDFC Bank) having more than 10% allocation in the Nifty 50 and BSE Sensex indices. If a position crosses the 10% threshold due to appreciation, MFs can no longer add to the position even if the fund manager finds the risk-reward attractive. This has resulted in most of the MFs being highly diversified owning anywhere from 25-70 stocks in the portfolio. PMS don’t have such restrictions and this allows them to create portfolios (concentrated or diversified) based on their own independent assessment of risk.
MFs also have restrictions on how much cash % they can maintain in their portfolio. Tax laws require equity funds to be at least 65% invested in equities restricting cash allocation to not more than 35%. This means that irrespective of whether there are attractive opportunities or not, an MF manager still needs to be 65% invested. However, this might only be a theoretical restriction as we rarely see MFs with less than 75% equity allocation. PMS fund managers don’t have these restrictions and can even be 100% in cash if the prices don’t make sense to them.
Focus/Incentives – PMS also have the benefit of higher focus compared to MFs. MFs, due to a higher cost structure and institutional imperatives (most are listed or are part of listed companies), need to manage a large AUM. Institutionally owned/listed and employee managed MFs also have incentives which disproportionately reward short term AUM growth. This focus on AUM gathering often results in too many schemes being launched and raising capital beyond the capacity of a strategy. This results in overdiversification and illiquidity risks. For eg. Small cap funds that manage more than 5000 crs and own 70 to 115 stocks. Also, the performance of large MFs entails survivorship bias as non-performing funds are closed or merged with better-performing funds.
Due to their lower cost structures, PMS operations can be profitably run even at sub-1000 cr AUM levels. This reduces the pressure to chase AUM growth and allows funds to be appropriately sized for their strategy. It also helps that most of the PMS are owned and managed by the same individuals. This results in higher skin in the game and better aligns incentives. It also leads to a more consistent investment philosophy over time as PMS fund manager attrition tends to be lower than MFs.
Pooling – A key difference between MF and PMS is that MF investors are invested in a pooled vehicle while PMS have separately managed accounts. If a PMS fund manager finds that any position of theirs is no longer attractive (for whatever reason), they can stop buying it for new investors. The new investors don’t have to own a stock which is not currently attractive as per the fund manager. However, due to pooling, new MF investors still end up owning stocks which the fund manager has stopped liking. This is because selling a stock can take several weeks to months. This is particularly the case in small and midcap funds where a large part of the portfolio comprises illiquid or semi-liquid stocks which cannot be exited in a short time.
Even during redemptions, MFs have to first sell their most liquid positions. This results in a change in portfolio characteristics for the remaining investors as they now own more illiquid stock than before. Separate accounts in PMS ensure that redemptions do not impact the portfolio characteristics for remaining investors.
Summary
- Both MFs and PMS have their pros and cons depending upon the context. Investors should weigh these pros and cons and not blindly invest just based on what’s currently fashionable.
- Higher fees and tax inefficiencies of PMS do not make them ideal if their strategies have high portfolio overlap with active MFs or index funds. This is particularly seen in large-cap oriented strategies. Quality of PMS performance reporting is still below par vs MFs.
- PMS have the advantage of higher flexibility and focus compared to MFs which increases the role of active management. Smaller-sized funds also reduce the problems of illiquidity and overdiversification. PMS maybe better placed in managing appropriately sized small/midcap or multicap oriented strategies.
Note: All the above views are general in nature. There will always be exceptions. Like large-cap PMS which will do much better than similar MFs or MFs which will not suffer because of institutional constraints.
______________________________________
1. As per AMFI and SEBI data
2. Assuming a 15% Gross Return